For years, we have conducted our business with an eye toward limiting adverse impacts on the environment and the communities in which we operate. One example is our shared infrastructure model, which is inherently sustainable—allowing us to maintain a relatively low carbon footprint and pursue resource efficiency. We strive to be responsible environmental stewards while efficiently managing our expansive infrastructure portfolio and every part of our organization.
Our goals.
Achieve carbon neutral goal in Scope 1 and 2 emissions for 2025.
Source 100% renewable energy in support of reaching our goal to be carbon neutral in Scope 1 and 2 emissions for 2025.
Our progress.
of our 2024 electricity consumption was from renewable energy sources1
of lit towers upgraded to energy-efficient LED lights2
in CA reduces energy costs and helps provide accessible solar electricity to local residents
1 Percentage calculated using 144,193 MWh of renewable energy contracted for 2024 compared with reported 2024 annual consumption of 155,665 MWh.
2 Percentage calculated based on 12,140 total lit towers as of December 31, 2024.
Converting our lighting systems on lit towers to LED3,4
3 Percentages calculated based on the total lit tower count as of December 31 of each year represented.
4The number of total lit towers is subject to slight fluctuations year over year as the result of regulatory changes.
Driving results through accountability.
To reach our goal of achieving carbon neutrality in Scope 1 and 2 emissions for 2025, we are investing in projects that benefit both our business and the environment. We have reduced our energy usage by switching to LED lighting on our lit towers and have made significant progress toward our goal of sourcing 100% renewable energy for 2025. Through retail agreements, we currently source around 114,000 MWh of renewable energy across 13 states, consolidating our electricity supply to secure cost savings and reducing our exposure to energy price volatility through multi-year contracts. Additionally, we source 30,000 MWh of renewable energy from the Priddy Wind Farm Project and the Pitts Dudik Solar Project, further reducing our carbon footprint and supporting sustainable energy solutions.
Our recent commitment to a long-term community solar partnership reduces our energy costs, helps us reach our 100% renewable energy goal and enables residents in select California communities to access cost savings on their monthly electricity bills. Community solar refers to local solar facilities shared by multiple community subscribers who receive credit on their electricity bills for their portion of the power produced. These projects help to provide equal access to the economic and environmental benefits of solar energy generation, while building a stronger, more resilient electric grid.
Renewable energy progress5
- Non-renewable energy
- Renewable energy
5 Renewable energy percentages were calculated by dividing the MWh of renewable energy contracted each year by the respective total annual electricity consumption, as included in the Environmental Data Tables.

Project spotlight.

Pitts Dudik Solar Project
We supported the development of a 50 MW solar farm, which became operational in August 2023.
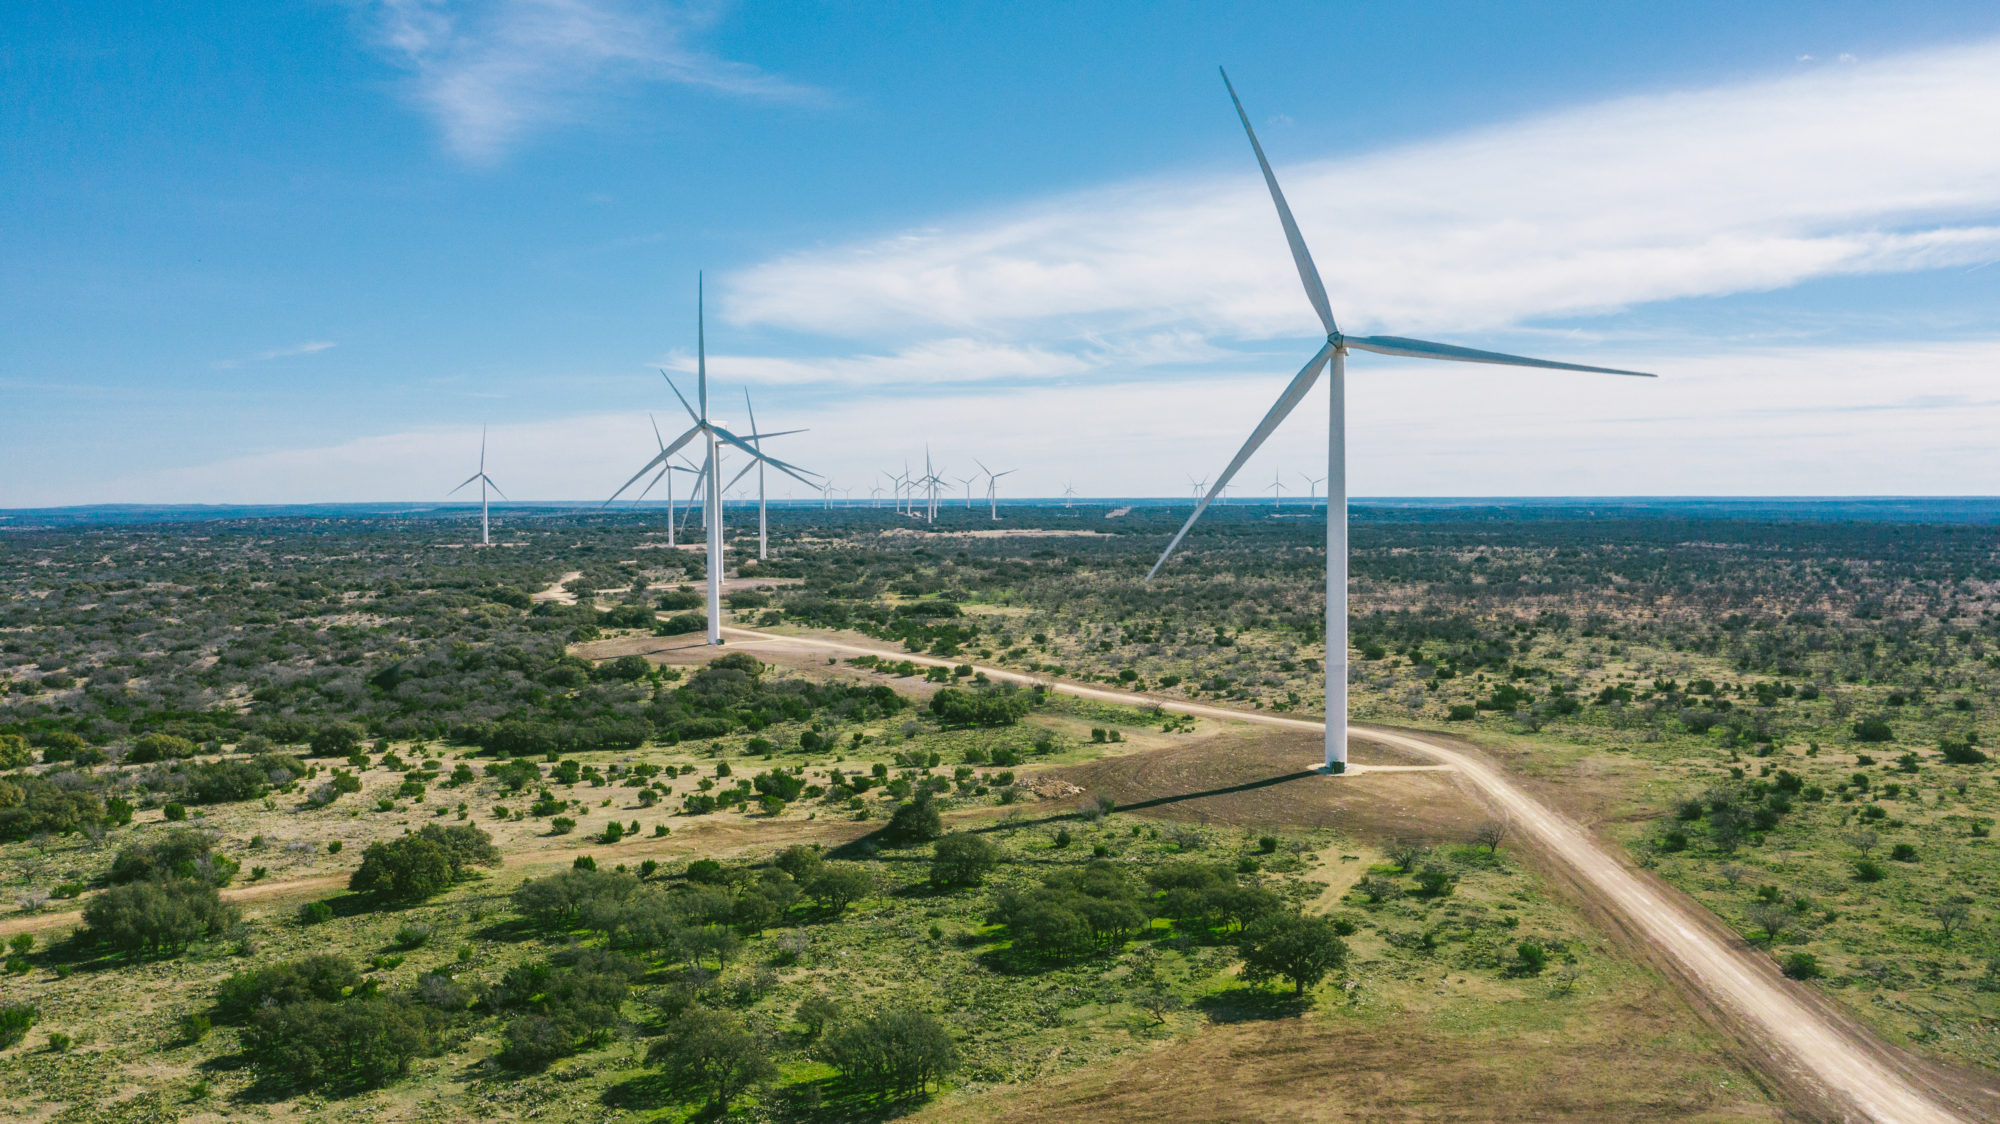
Priddy Wind Project
A newly built 300 MW wind farm, where we have procured renewable energy contracts that deliver clean energy to local grids.
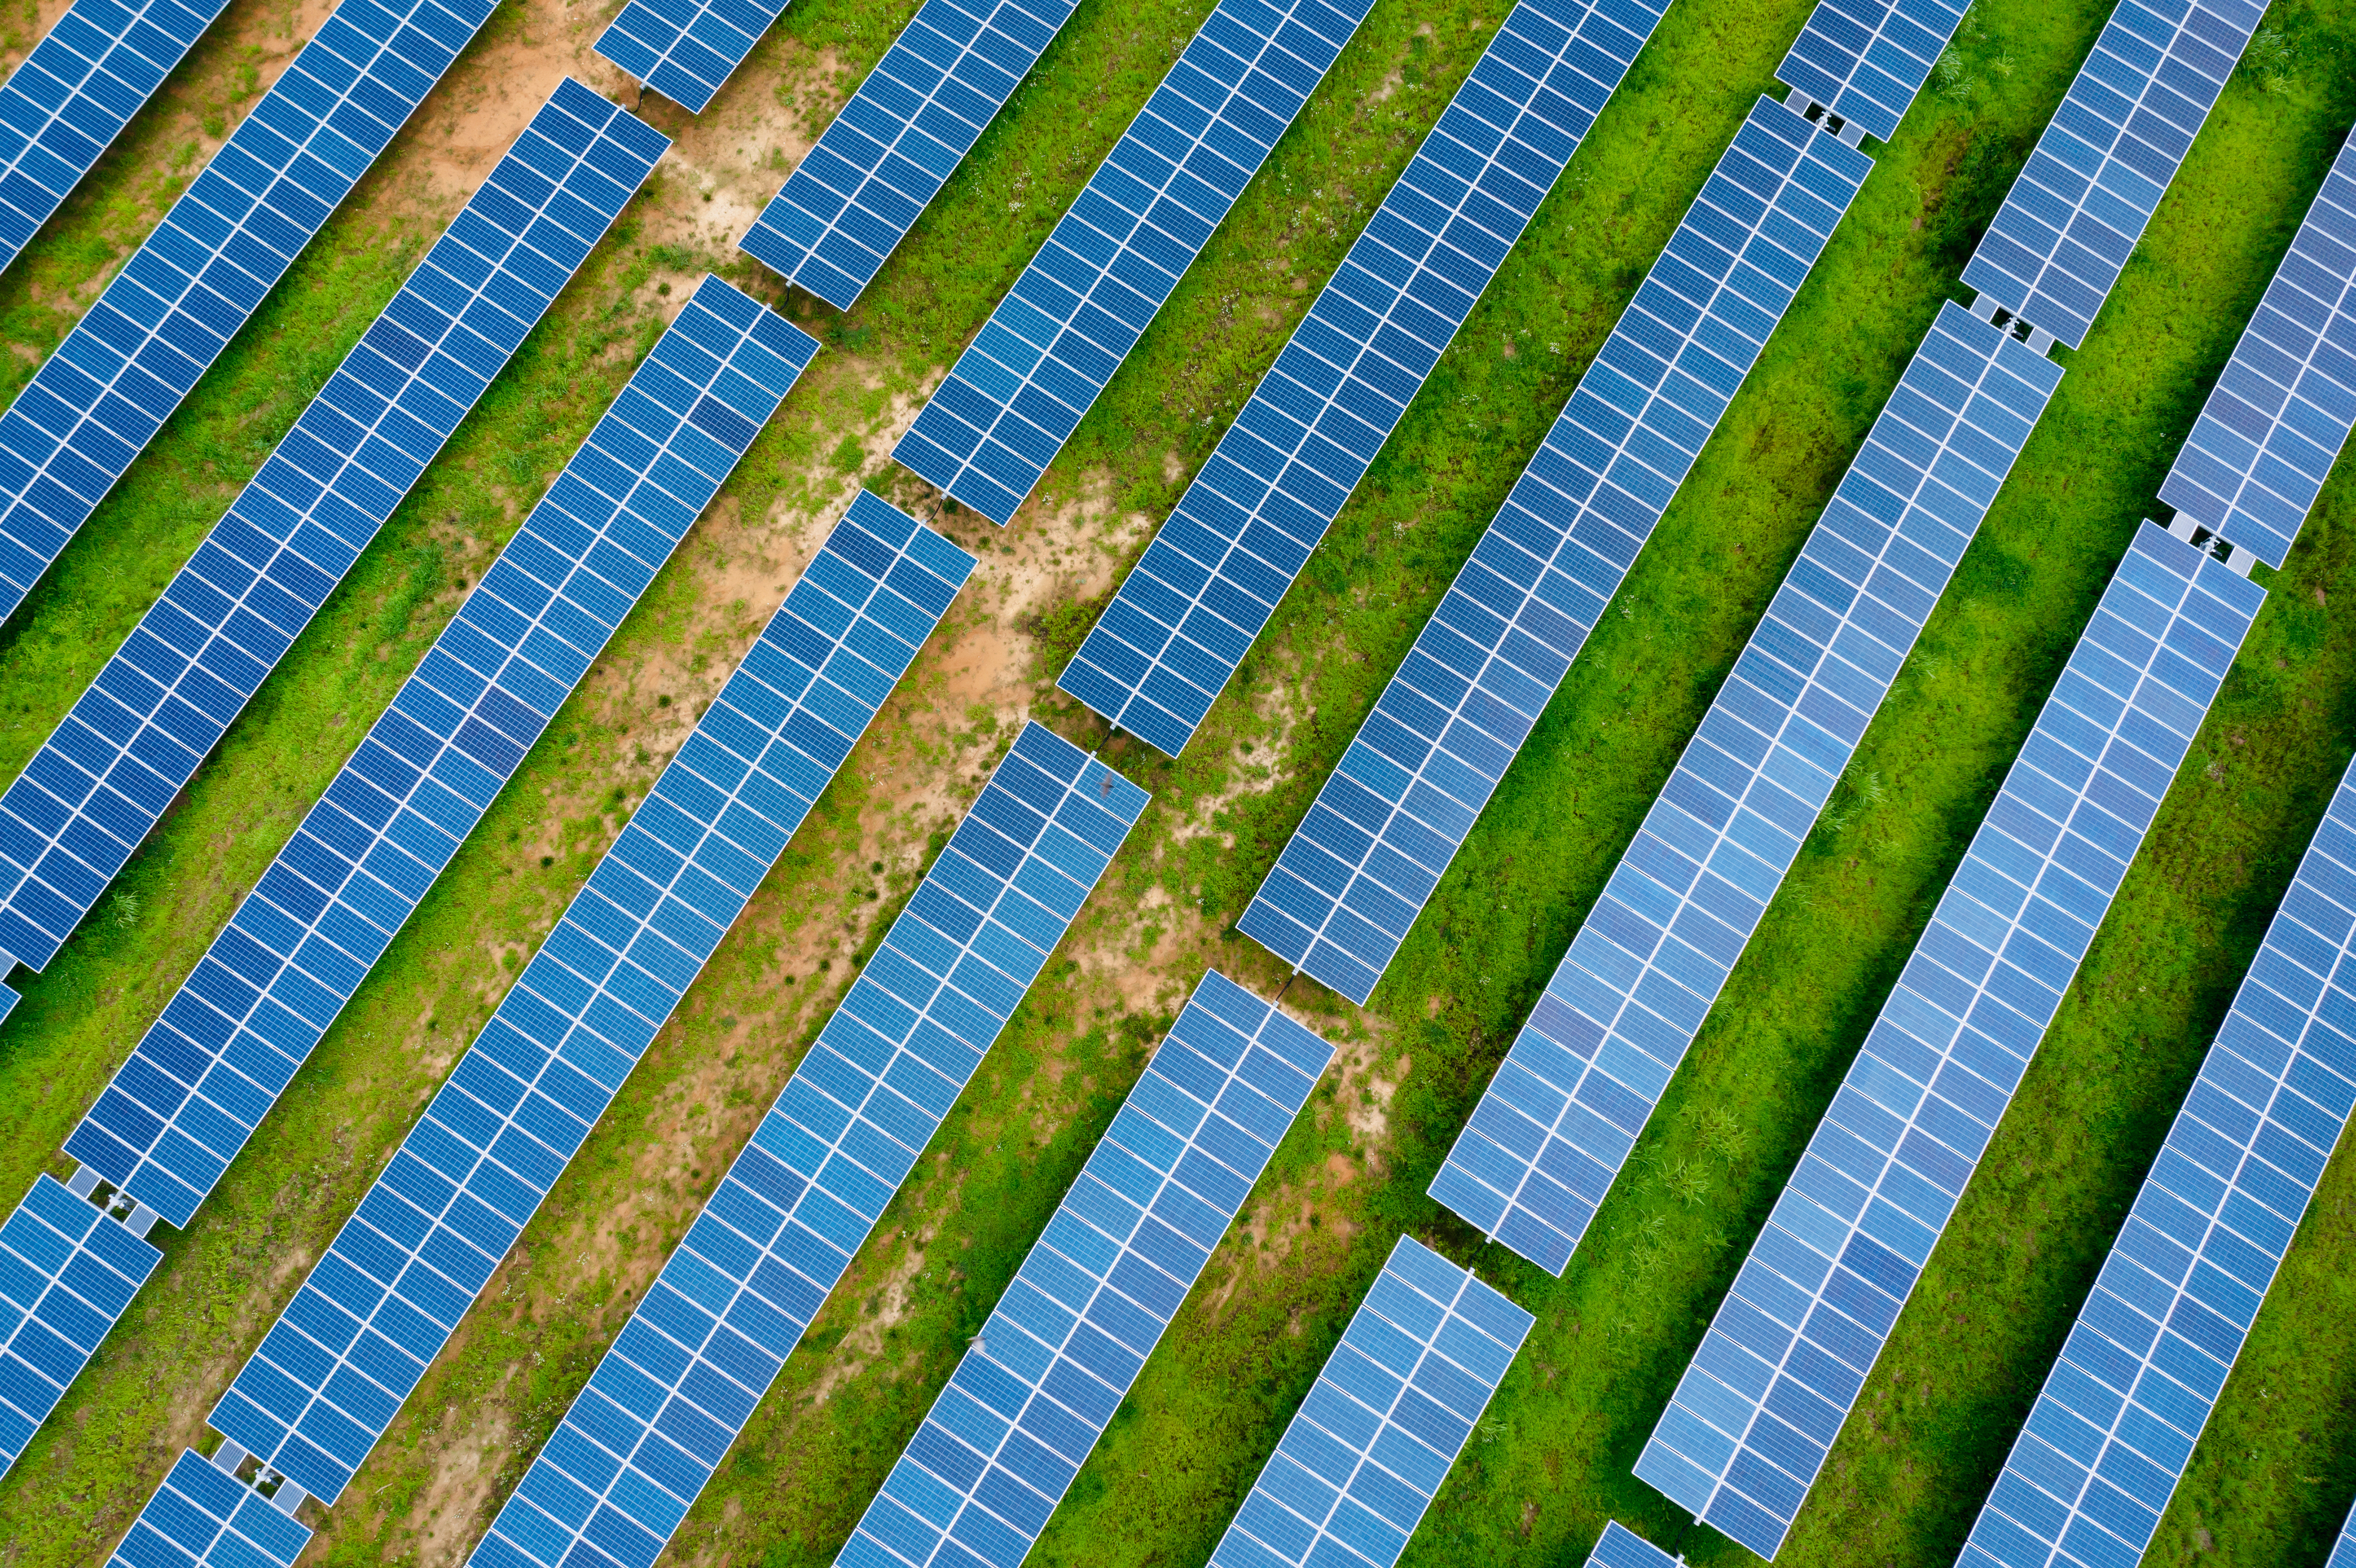
Community Solar
We committed to a community solar partnership that reduces our energy costs and helps provide accessible solar electricity programs to local communities.
Understanding our emissions.
To craft an informed strategy to reduce our footprint, we calculated our Scope 1 and 2 GHG emissions based on energy utilization across our operations, including towers, small cells and fiber, offices and warehouses, fleet and generators.
2024 Fuel and Energy Consumption6,7
| Asset Class | Natural Gas (MMBtu) | Electricity (kWh) | Diesel, Gasoline and Propane (MMBtu) | Refrigerants (kg)12 |
|---|---|---|---|---|
| Towers8 | — | 55,862,384 | — | 15 |
| Small Cells & Fiber9 | — | 72,448,808 | — | — |
| Offices & Warehouses10 | 22,337 | 27,353,449 | — | 112 |
| Fleet11 | — | — | 111,503 | 94 |
| Generators | 699 | — | 25,545 | — |
| Total | 23,036 | 155,664,641 | 137,048 | 221 |
6 Based on an operational control approach, as defined by WRI GHG Protocol and scope guidance. Boundaries include all material operating locations as they operated during the 2024 reporting period. In early 2025, we announced the agreement to sell our Fiber segment, which includes our fiber and small cell assets, with the transaction expected to close in the first half of 2026. When consummated, the transaction will change our energy consumption and emissions profile in future years as we transition to a pure-play tower business.
7 Where actual consumption data was not available, we used a sampling approach or public information, such as equipment fuel efficiency and power ratings, to estimate fuel and energy consumption.
8 Electricity consumption and resulting emissions associated with HVAC systems situated in ground shelters at our tower sites are calculated based on the applicable energy consumption factors for each type of HVAC unit (e.g., central air, window unit, etc.) that was operational in 2024 at such sites, taking into account assumptions regarding (i) customer tenancy at company owned shelters, (ii) customer reliance (or lack thereof) on our HVAC units and (iii) HVAC system operations in unoccupied shelters. The 2024 analysis identified that HVAC electricity use was incorrectly included for units located in unoccupied shelters in 2022 and 2023. This has been corrected in the 2024 calculation.
9 Prior to 2024, we misinterpreted remote monitoring unit data for a limited number of iDAS venues, incorrectly distinguishing between Crown Castle and customer electricity usage. The 2024 calculations correctly attribute electricity use to Crown Castle and our customers at these venues.
10 Based on actual consumption data for offices, owned and leased square footage, and estimates derived from nationwide energy intensity statistics from the Energy Information Administration’s (EIA) Commercial Building Energy Consumption (CBEC) Survey for the remainder of the offices.
11 Based on estimated allocation between diesel and gasoline vehicles.
12 Refrigerant estimates were determined using vehicle data, active HVAC unit data, and assumed refrigeration and HVAC systems in office and warehouse spaces, based on square footage, using the EPA’s Accounting Tool to Support Federal Reporting of Hydrofluorocarbon Emissions: Supporting Documentation (Oct. 2016).
Scope 1 & 2 Greenhouse gas emissions13,14
- Towers
- Small Cells & Fiber
- Offices & Warehouses
- Fleet
- Generators
| Asset Class | Scope 1 (MTCO2e) | Scope 2 (MTCO2e)15 |
|---|---|---|
| Towers | 29 | 587 |
| Small Cells & Fiber | — | 2,966 |
| Offices & Warehouses | 1,401 | 459 |
| Fleet | 8,020 | — |
| Generators | 1,924 | — |
| Total | 11,374 | 4,012 |
| Asset Class | Scope 1 (MTCO2e) | Scope 2 (MTCO2e)15 |
|---|---|---|
| Towers | 41 | 879 |
| Small Cells & Fiber | — | 3,094 |
| Offices & Warehouses | 2,643 | 653 |
| Fleet | 9,623 | — |
| Generators | 2,024 | — |
| Total | 14,332 | 4,626 |
| Asset Class | Scope 1 (MTCO2e) | Scope 2 (MTCO2e)15 |
|---|---|---|
| Towers | — | 7,556 |
| Small Cells & Fiber | — | 7,713 |
| Offices & Warehouses | 1,927 | 3,340 |
| Fleet | 9,679 | — |
| Generators | 1,722 | — |
| Total | 13,328 | 18,609 |
13 Based on an operational control approach, as defined by World Resource Institute (WRI) GHG Protocol and scope guidance. Boundaries include all material operating locations as they operated during the 2024 reporting period. In early 2025, we announced the agreement to sell our Fiber segment, which includes our fiber and small cell assets, with the transaction expected to close in the first half of 2026. When consummated, the transaction will change our energy consumption and emissions profile in future years as we transition to a pure-play tower business.
14 We used emission factors from 40 CFR Part 98 Tables C-1 and C-2 and EPA eGRID factors. Global Warming Potential documented in the Intergovernmental Panel on Climate Change AR5 report was used to calculate CO2e for methane (CH4) and nitrous oxide (N2O).
15 Our 2022 - 2024 Scope 2 emissions were calculated using WRI GHG Protocol’s market-based method. Prior years’ Scope 2 emissions calculations were reported using WRI GHG Protocol’s location-based method. Refer to the Environmental Data Tables for Scope 2 emissions calculated using the location-based method covering the years indicated therein.
Scope 3
For 2024, we built upon the foundation of our first comprehensive Scope 3 emissions inventory, continuing to report on the categories that are relevant to our business. This analysis has confirmed the most significant drivers of our value chain emissions and highlighted areas where we may be able to impact future reductions. We are working with our customers and suppliers to ensure alignment of priorities and explore potential options for reducing emissions across our entire value chain.
Our Scope 3 emissions are primarily driven by:
- Category 13, Downstream leased assets: Emissions from our customers’ energy use on our infrastructure assets, primarily related to electricity use for telecommunications equipment and HVAC units at tower sites
- Category 2, Capital goods: Emissions from construction-related spend, largely associated with fiber installation
- Category 1, Purchased goods and services: Emissions from the spend supporting our ongoing operations
The remainder of our Scope 3 emissions inventory is composed of categories that we believe are individually less material to our overall footprint, including fuel- and energy-related activities, upstream transportation and distribution, waste generated in operations, business travel and employee commuting. Refer to the Environmental Data Tables for our comprehensive emissions inventory.
Scope 3 Emissions
- Downstream Leased Assets
- Capital Goods
- Purchased Goods and Services
- Other
| Category | Scope 3 (MTCO2e)16 |
|---|---|
| Downstream Leased Assets17 | 994,816 |
| Capital Goods18 | 192,820 |
| Purchased Goods and Services18 | 74,686 |
| Other19 | 19,690 |
| Total | 1,282,012 |
| Category | Scope 3 (MTCO2e)16 |
|---|---|
| Downstream Leased Assets17 | 1,116,621 |
| Capital Goods18 | 357,139 |
| Purchased Goods and Services18 | 117,318 |
| Other19 | 24,385 |
| Total | 1,615,463 |
16 Scope 3 emissions were calculated using the Corporate Value Chain (Scope 3) Accounting and Reporting Standard: Supplement to the GHG Protocol Corporate Accounting and Reporting Standard. Scope 3 emissions quantification is subject to significant inherent measurement uncertainty due to the emissions being outside of Crown Castle’s organizational boundaries, where the company has limited control over the availability of primary data. Additionally, uncertainties arise from (1) using GHG emissions factors, which are themselves estimates, in mathematical models for calculating emissions and (2) the models' inability, due to incomplete scientific knowledge and other factors, to precisely measure the relationship between various inputs and the resultant GHG emissions in all scenarios. In early 2025, we announced the sale of our small cells and fiber solutions businesses, with the transaction expected to close in the first half of 2026. This transaction will change our emissions profile in future years as we transition to a towers-focused business model.
17 Scope 3 emissions from Category 13: Downstream leased assets were calculated separately for tower, small cell, and fiber customers, with emissions across all three asset types calculated by zip code to align with the correct eGRID regions. For tower customer energy use, we applied the average data method, estimating annual consumption per tower for each of our largest customers individually and grouping similar smaller customers together based on their anticipated energy use profiles. These estimates were validated with a sample of our largest customers. Where applicable, customer renewable energy contributions were factored in to reduce market-based emissions, using publicly reported data. For small cell customers, we estimated average equipment electricity use based on device type and location. For fiber customers, we calculated average energy consumption based on service type and speed.
18 Scope 3 emissions from Category 1: Purchased goods and services and Category 2: Capital goods were calculated using the spend-based method based on the economic value of goods and services purchased or acquired as recorded in Crown Castle’s financial reporting system. Certain spend categories, such as taxes, land rent, and payroll-related spend, are not included in the analysis because Crown Castle determined that there are not significant emissions associated with the spend. Total category spend was multiplied by the corresponding NAICS emissions factors from NAICS v1.3 (2024).
19 Other Scope 3 emissions include categories that Crown Castle believes are individually less material to our overall footprint but are relevant to our operations, including fuel- and energy-related activities, upstream transportation and distribution, waste generated in operations, business travel, employee commuting, and upstream leased assets. Refer to the Environmental Data Tables for our comprehensive emissions inventory and additional detail regarding the calculation approaches utilized.
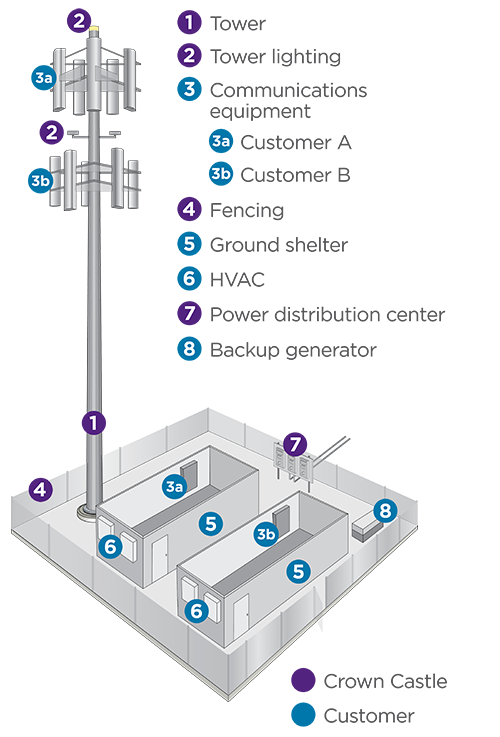
Exploring downstream emissions on our tower sites.20
Crown Castle collaborates closely with our customers to connect communities through our shared infrastructure portfolio. At our tower sites, we generally own the tower and lighting beacons and manage site maintenance, while our customers generally own their communications equipment, tower cabling, ground shelter with HVAC and IT equipment and backup generators.
The emissions stemming from our customers' energy consumption on our infrastructure assets are accounted for in their Scope 1 and 2 emissions and are represented in our Scope 3 emissions. From 2023 to 2024, we observed an 11% reduction in emissions from downstream leased assets. This decrease reflects both our largest tower customers’ continued progress in decarbonization—through enhanced energy efficiency and increased use of renewable energy—and improvements in how we estimate customer electricity consumption at our tower sites. By aligning sustainability priorities and supporting each other’s transition to lower-carbon operations, we continue to benefit from their environmental commitments while reinforcing the role of shared infrastructure in enabling a more sustainable digital future.
20 Crown Castle’s Scope 3 emissions from Category 13: Downstream leased assets originate from tower, small cell, and fiber customers. However, nearly 90% of those emissions are attributed to energy use by our tower customers, and consequently, this section focuses on exploring downstream emissions at our tower sites.
Cutting back on consumption.
We’re taking steps to conserve water and reduce waste generated across our business. Our water use and waste generation stem almost exclusively from our office operations. Our current water efficiency initiatives include selecting drought-tolerant native species for landscaping, using zoned and timed sensors to reduce water use, using reclaimed water for landscape irrigation and installing energy-efficient appliances and fixtures in connection with our new office buildouts and renovations.
Water consumed by office (gallons)21
| Office | 2024 |
|---|---|
| Houston, TX | 4,060,364 |
| Canonsburg, PA | 1,006,000 |
| Phoenix, AZ | 297,000 |
| Doral, FL | 59,840 |
| Albany, NY 22 | 26,400 |
| Total | 5,449,604 |
21 Water is reported for Crown Castle’s owned office locations. Changes in our hybrid work schedule impacted the comparability of our prior year water utilization; as such, we have elected to present a single year of water consumption data.
Many of our employees work in a hybrid or fully remote capacity. As such, we are reporting waste generated both in Crown Castle offices and by employees while working from home. Our current waste reduction initiatives across offices include using recyclable materials, digitizing operations and donating old materials to reduce lifecycle impacts.
Waste generated and recycled (tons)
| Type | Waste generated (tons)22 | Scope 3 GHG emissions from waste generated in operations (MTCO2e)23 |
|---|---|---|
| Office waste landfilled | 86 | 55 |
| Office waste recycled | 159 | 16 |
| Remote work waste landfilled | 188 | 120 |
| Remote work waste recycled | 349 | 35 |
| Total | 782 | 226 |
22 Many of our employees work in a hybrid capacity (mix of remote and in-office work), while other are fully remote or fully in-office. As such, our calculation methodology projects waste generated and recycled both in Crown Castle offices (owned and leased) and remotely (e.g., employees working from home).
23 We used emissions factors from U.S. EPA, 2024, Emission Factors for Greenhouse Gas Inventories, Table 9 (waste).
Protecting ecosystems and biodiversity.
Our shared infrastructure assets are dispersed across the country on land we own, lease or that’s in the public right of way. Due to our expansive reach, we work to identify and reduce the potential impact our deployments and operations could have on local ecosystems and biodiversity.
Before deploying infrastructure, our environmental compliance team analyzes potential impacts on endangered wildlife, wilderness areas, historic preservation areas and sensitive ecosystems like wetland habitats. In the event that any of these potential impacts are identified, we engage third-party experts to suggest modifications or work with us to implement protective measures. Once deployments are complete, we actively monitor our assets and take steps to minimize risks to the surrounding habitats.

Our seasonal bird program.
Occasionally, protected bird species select our towers as nesting sites. When this happens, processes are activated to track and document these sites. To facilitate regulatory compliance, we developed a state-specific bird guide that includes nesting seasons by species, making it easier for all parties on our sites to follow the guidelines. We have procedures in place to protect identified nests, including limiting on-site access and nest relocation.
sites identified with active nests or protected species24
migratory bird protection courses completed24
24 As of December 31, 2024.