While logged into the Controller, monitoring the status of individual active nodes is carried out by device in the Monitor section.
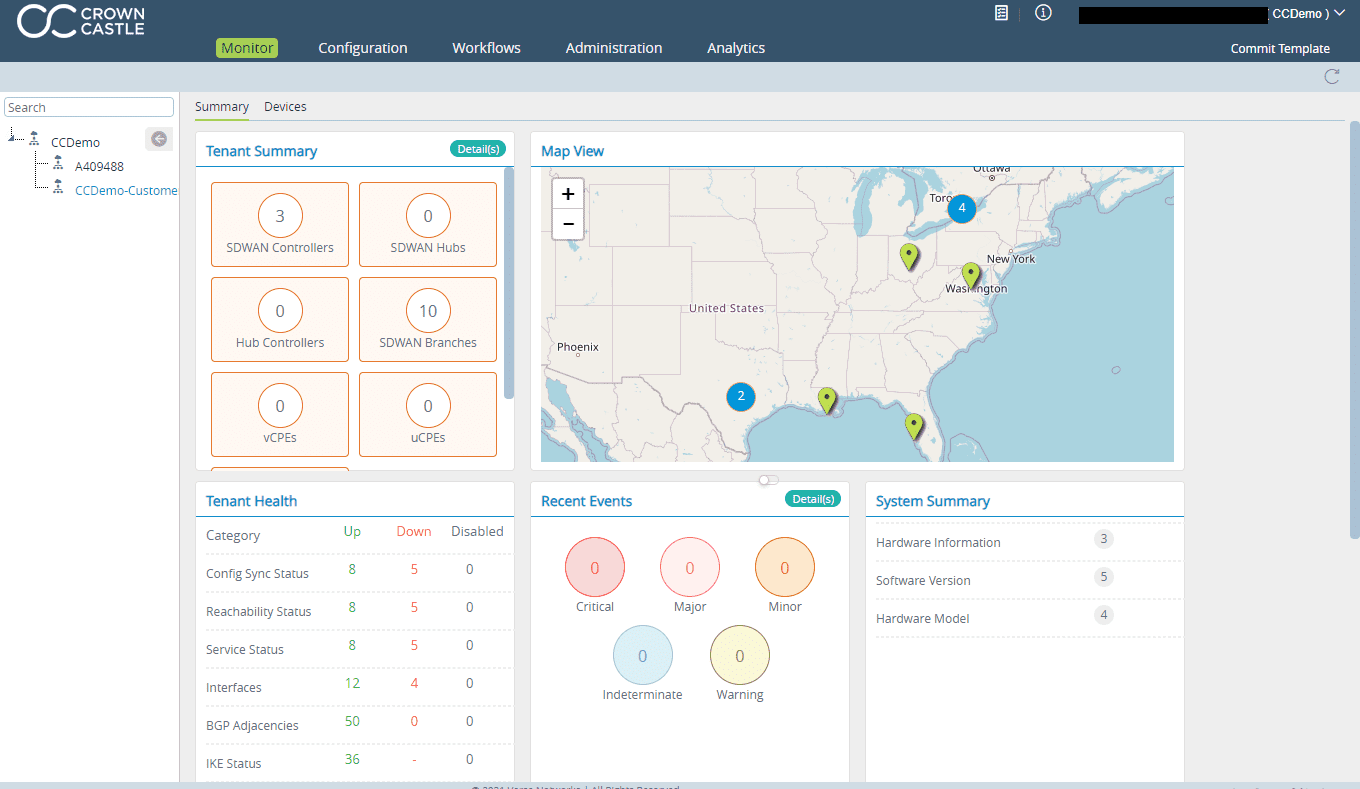
The main view will show you a summary of all active nodes, a map of your locations, a report of device health and recent event history.
Node summary.
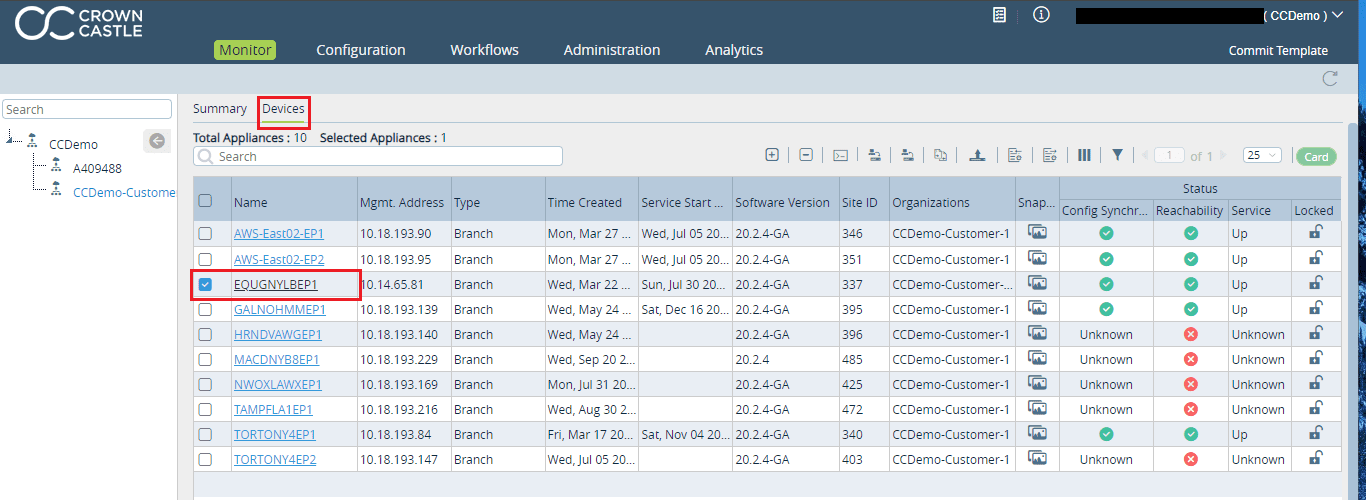
To focus down on a single device node, click the Devices tab at the top and select the node to view in detail.
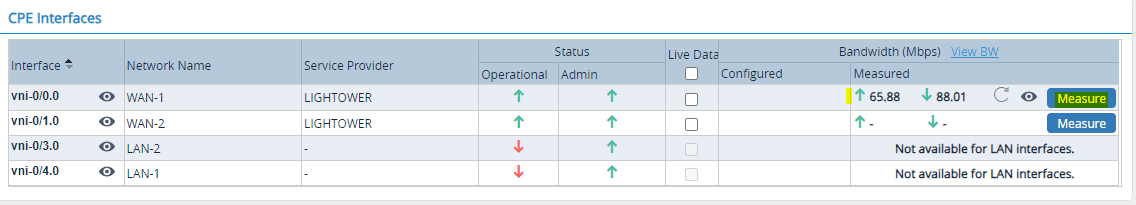
The node view summary page has a few pieces of information related to individual WAN connections and status.
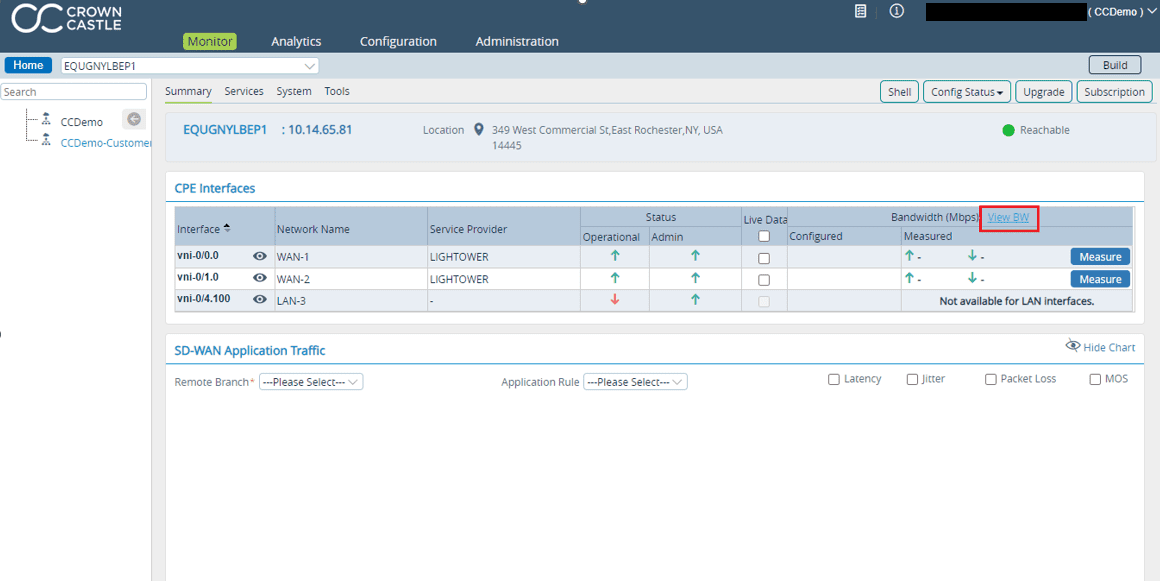
Here you can now see an estimated bandwidth capability. Please note, this is not a comprehensive or accurate bandwidth test. This test is between the device and its parent controller only. It’s also subject to different factors, like the current throughput utilization of active services, the state of the internet path, internet latency and the current demand on the Controller itself at the time of request. However, it can provide a rough estimation of available bandwidth for reference.
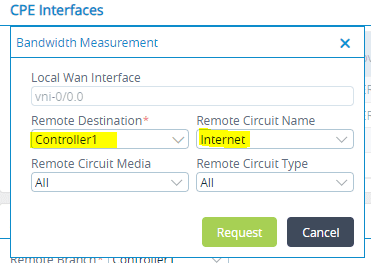
By clicking “Measure” you can view the active throughput bandwidth with the live monitoring graphs. This will bring up a dialogue block that will allow you to select the site-to-site traffic that you want to measure and monitor. For baseline measurements, one of the Controllers may be selected at a time.
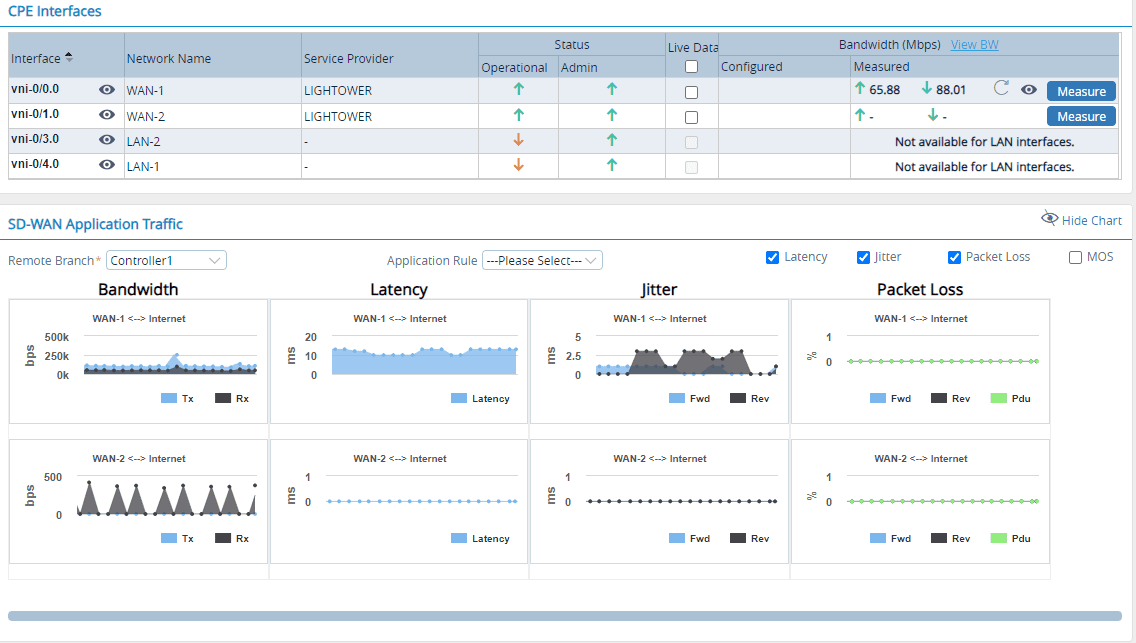
Now you will be able to see various windows detailing live traffic monitoring. You can also select useful flags to monitor latency, jitter, packet loss and a mean opinion score (MOS) that provides an estimate of overall quality of connectivity.
Node services.
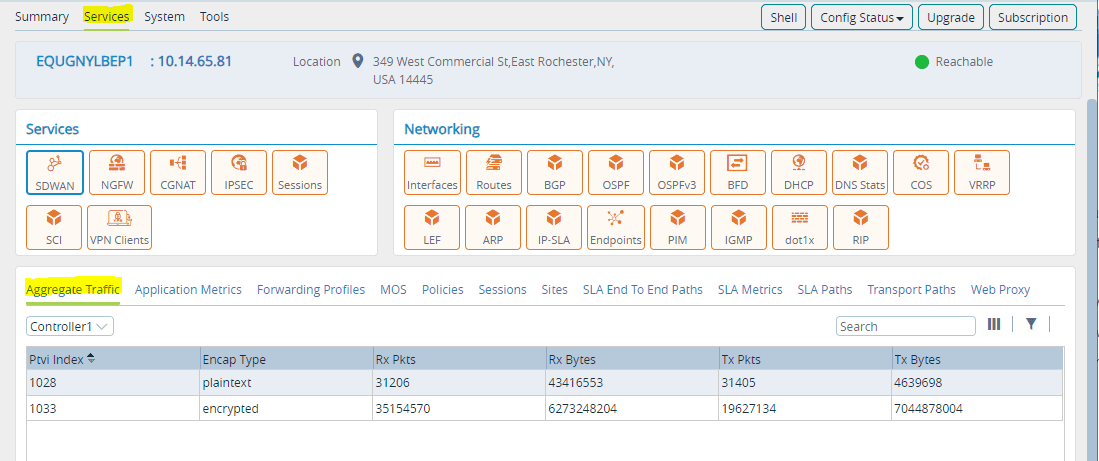
To view active features and monitoring within a specific node, click the Services tab, select any service and choose a site-to-site connection to monitor. Here you will also find packet counts and categories reported.
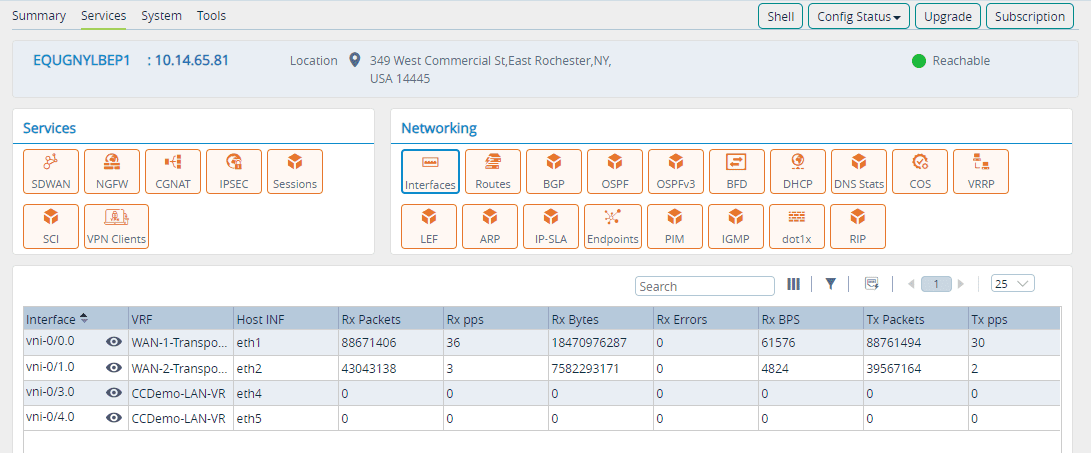
Other useful tools are available for monitoring specific network elements configured on the node, including global packet statistics on individual interfaces:
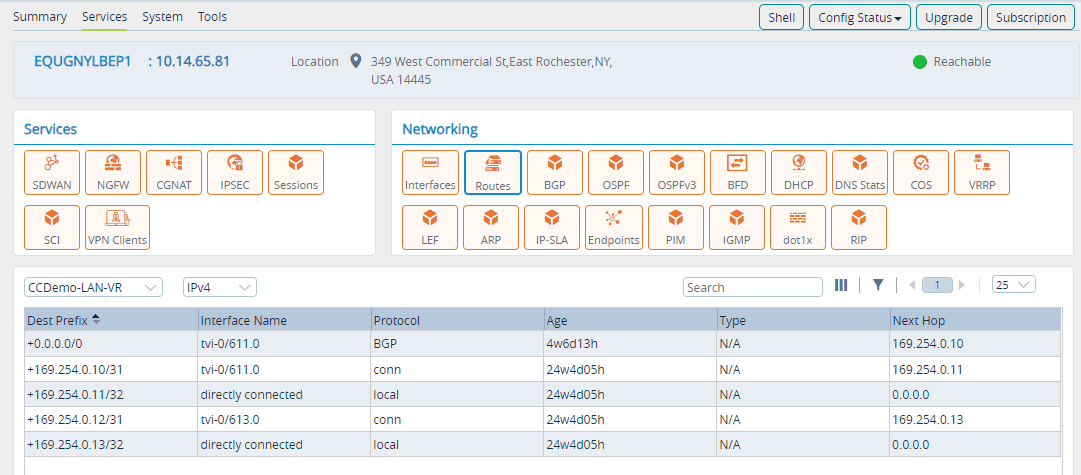
And individual configured routes available by interface:
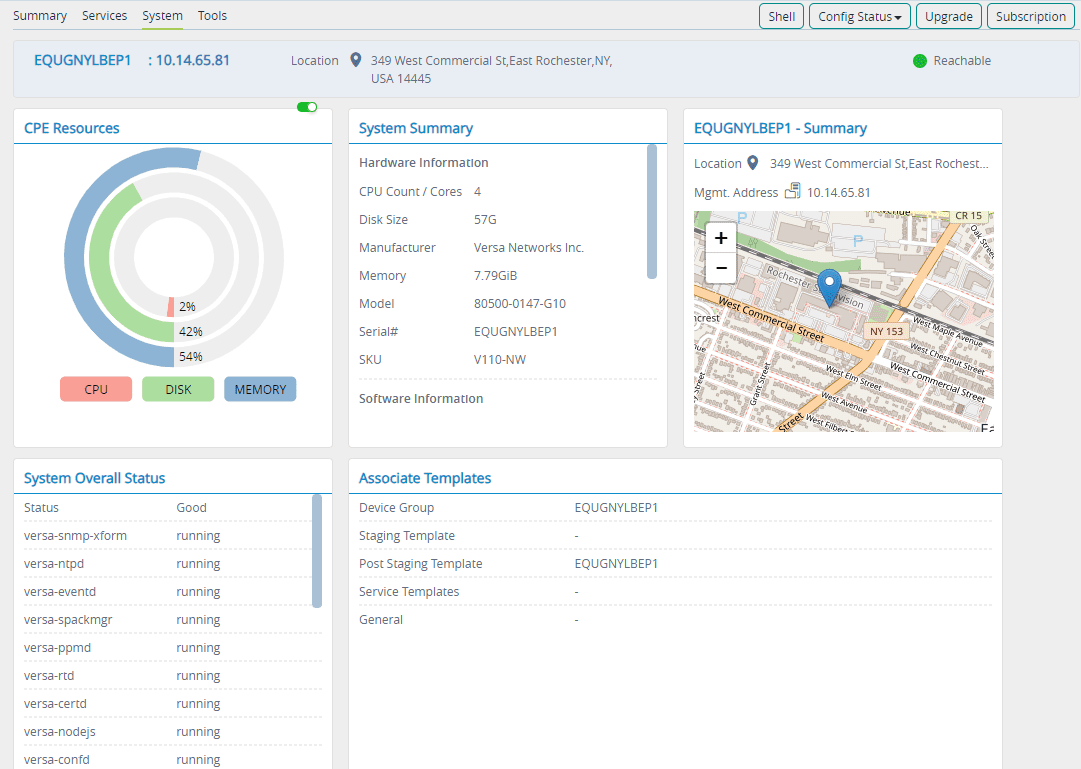
System status.
Node device status can also be monitored on the System tab. Here you will find central processing unit (CPU) health, geo location and overall software system status.
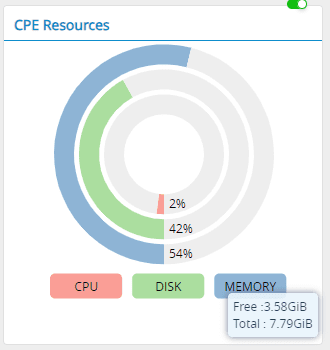
Hovering over the CPU component will also provide additional information.
Troubleshooting tools.
Basic troubleshooting tools are available on each node. Here is an example of a standard trace route test:
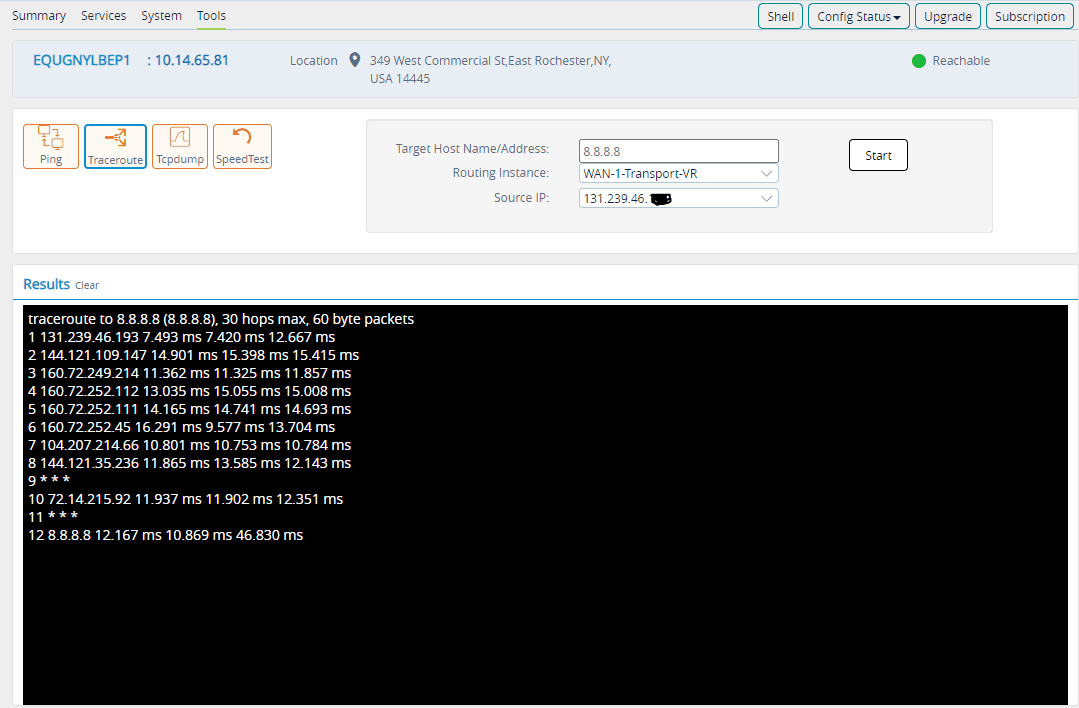
Note: When using the SpeedTest option, you must provide a fully qualified domain name (FQDN) or IP to an available speed test service that supports open access testing. Most public servers are on secure ports and will not work in this field.
Monitor navigation.
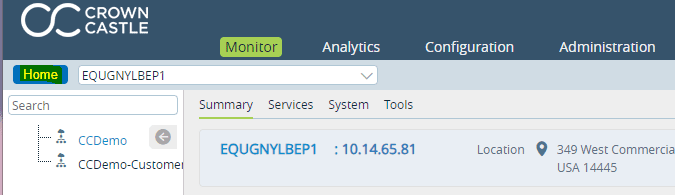
To leave the Node Monitor view and return to the Organization Monitor view, click the Home button.